工作案例:NSQ监控建设
前言
- 之前在工作中出现了一个问题,消息队列NSQ的消息积压,导致业务出现问题。
- 该问题的根本原因是消费端无法及时消费消息,导致消息堆积。
- 为了解决该问题,我们对NSQ进行了监控建设,以便及时发现问题并解决问题。
基本配置
- 本文环境是MacOS进行的搭建,其他系统请自行查找对应的安装方式。
Prometheus
brew install prometheus
安装后,我们能看到: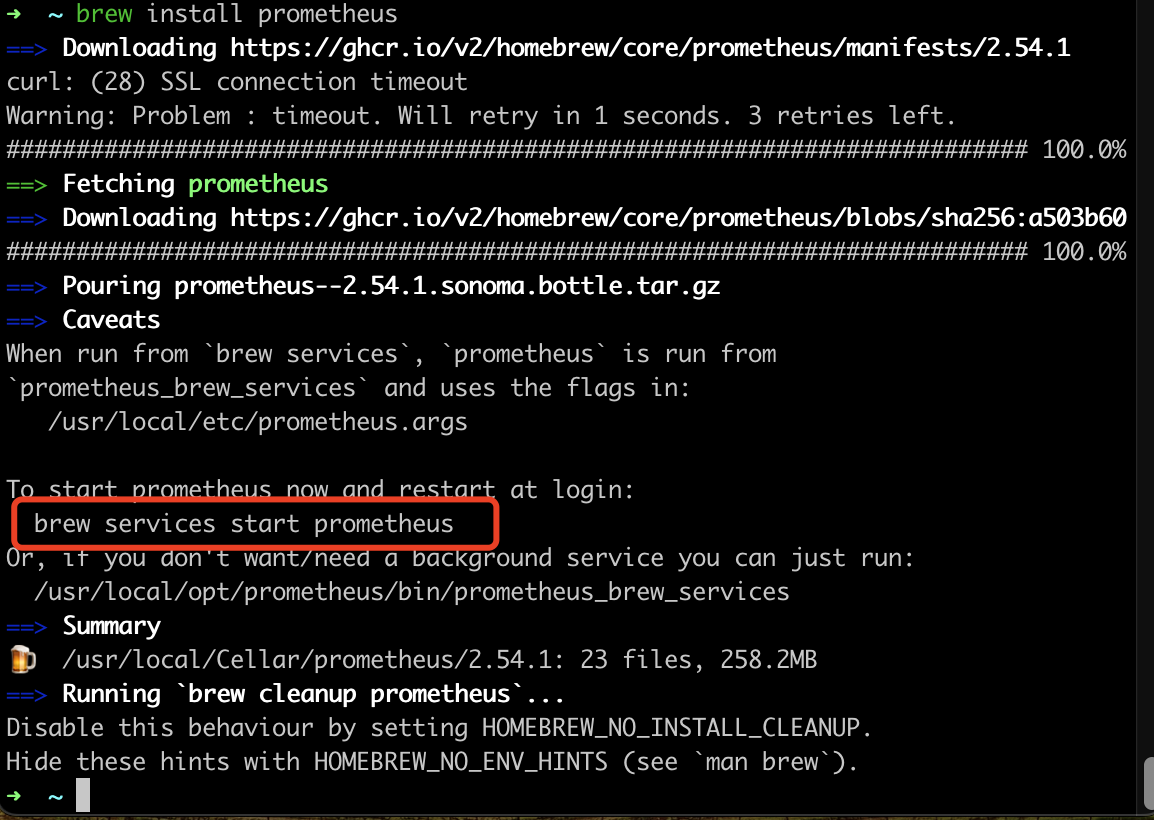
- 我们可以直接通过 brew services start prometheus 在后台运行Prometheus 服务。
- 启动后,我们访问 http://localhost:9090/ 如果正常访问到页面,也就说明安装没有问题。
配置文件
默认的配置文件可以这样看:
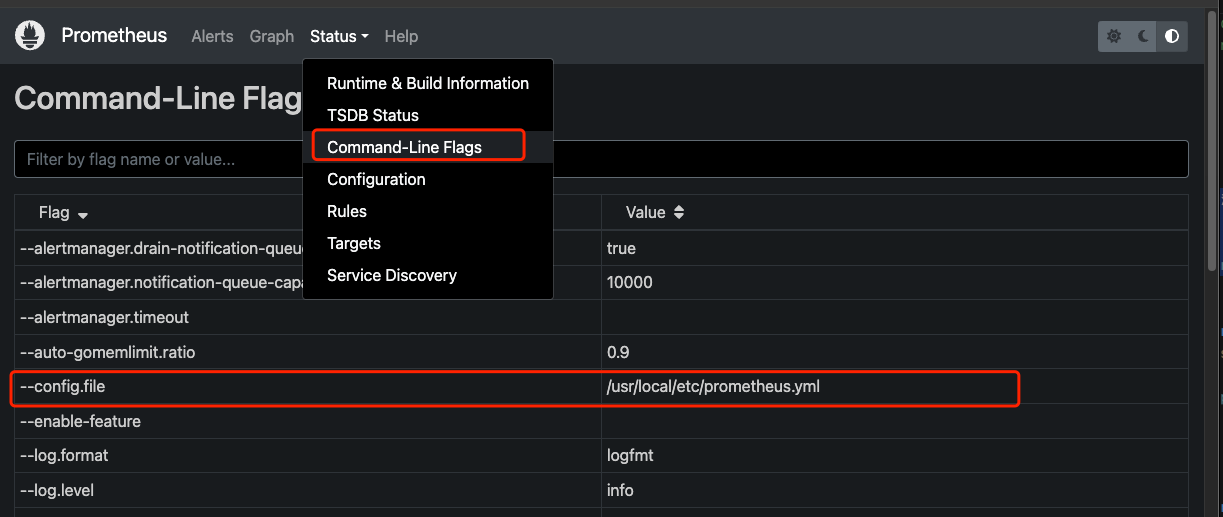
- 我们 cat /usr/local/etc/prometheus.yml,就可以看到当前的配置文件
Grafana
brew install grafana
- 安装完成后就可以直接通过brew services start grafana直接运行服务
nsq_exporter
原项目是:https://github.com/lovoo/nsq_exporter 但是太久没有维护了,自己拉下来维护了。
Install
1 | |
Run
1 | |
运行后就会看到:

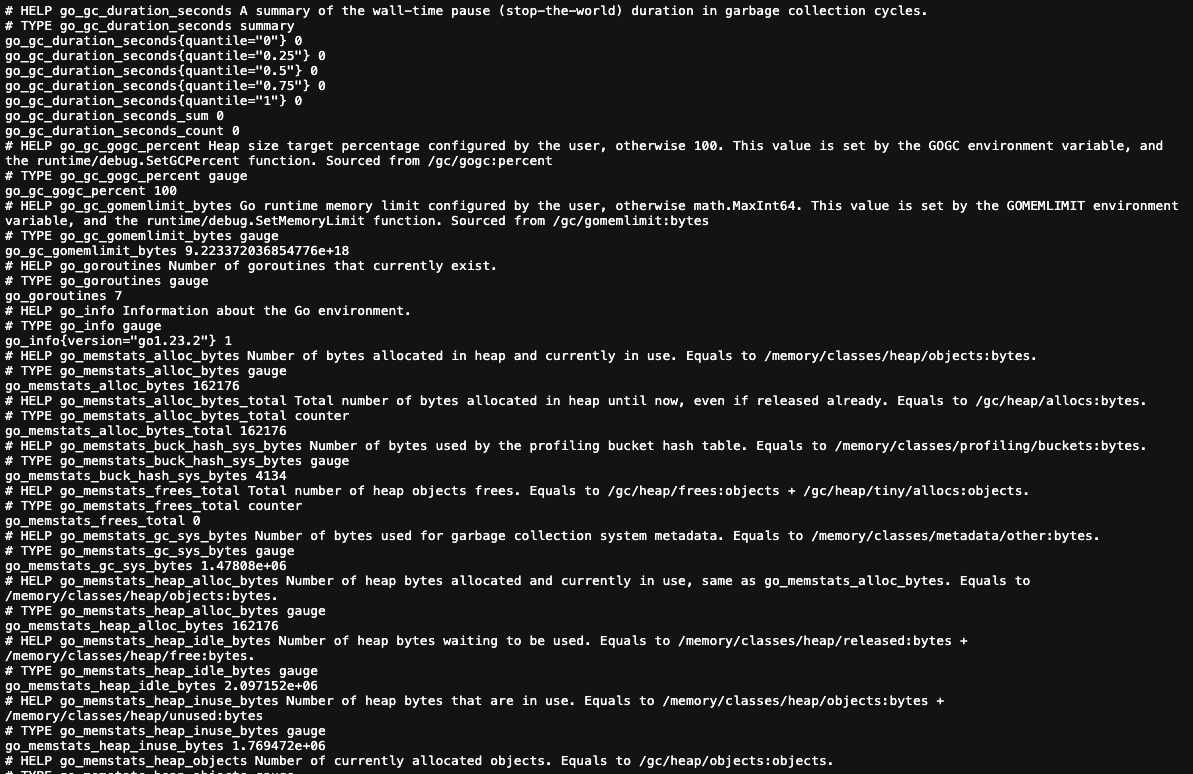
Metrics
- 访问:http://localhost:9117/metrics 然后就能看到采集到的数据:
接入数据
Prometheus
- 我们可以在Prometheus中配置数据源,然后导入我们的仪表盘。
- 编辑配置文件
1
2
3
4
5
6
7
8
9
10
11
12
13global:
scrape_interval: 1s
evaluation_interval: 5s
scrape_configs:
- job_name: "prometheus"
static_configs:
- targets: ["localhost:9090"]
//新增的NSQ采集任务
- job_name: 'nsq'
static_configs:
- targets: ['localhost:9117'] - 编写后重启 prometheus brew services restart prometheus
- 然后就可以在 prometheus 中查询到新接入的数据了
配置grafana:
- 直接加入新的 数据源配置面板即可
指标说明
我们直接通过nsq_exporter拿到的指标包含很多种类:
- Go 程序基本指标
- GC,内存,线程数
- NSQ的channel,topic的一些指标
监控指标
从目的反推我们需要监控什么
我们需要看到是否有消息积压
我们需要提前预警
提前解决消息积压带来的问题
Depth:
- 当前内存中 + 磁盘上的消息总数(即可等待传递的消息“积压”)
- 这个指标为这次要做的关键点
- 默认为8000,监控值可以在5000
Timed Out:
- 消息超时处理也会导致 消息积压,所以这个指标也是需要监控的
- 这个可以设置在10-20,处理事件超时
Requeued:消息重新回到队列中的次数(静态数据,会递增
- 该参数最好是梯度报警
- 100 一次
- 500一次
- 1000 一次
参考
工作案例:NSQ监控建设
https://blog.codefish.net/2024/12/30/job-case-job-case-NSQ监控建设/